Appgate SDP monitoring
This Docker compose stack allows you to quickly setup monitoring of an Appgate SDP Collective. Instrumentation is achieved using the Appgate REST API, and all metrics are created from that gathered information. The metrics are a subset of the data available via the Controller’s on-board prometheus exporter (snmp-exporter). Even though the information is quite elemental, we have found that these metrics make a great basis on which to build a system state view and for alert management.
Logging, log message, request and message tracing is not part of this work.
Screenshots
Dashboard with live stats and alerts
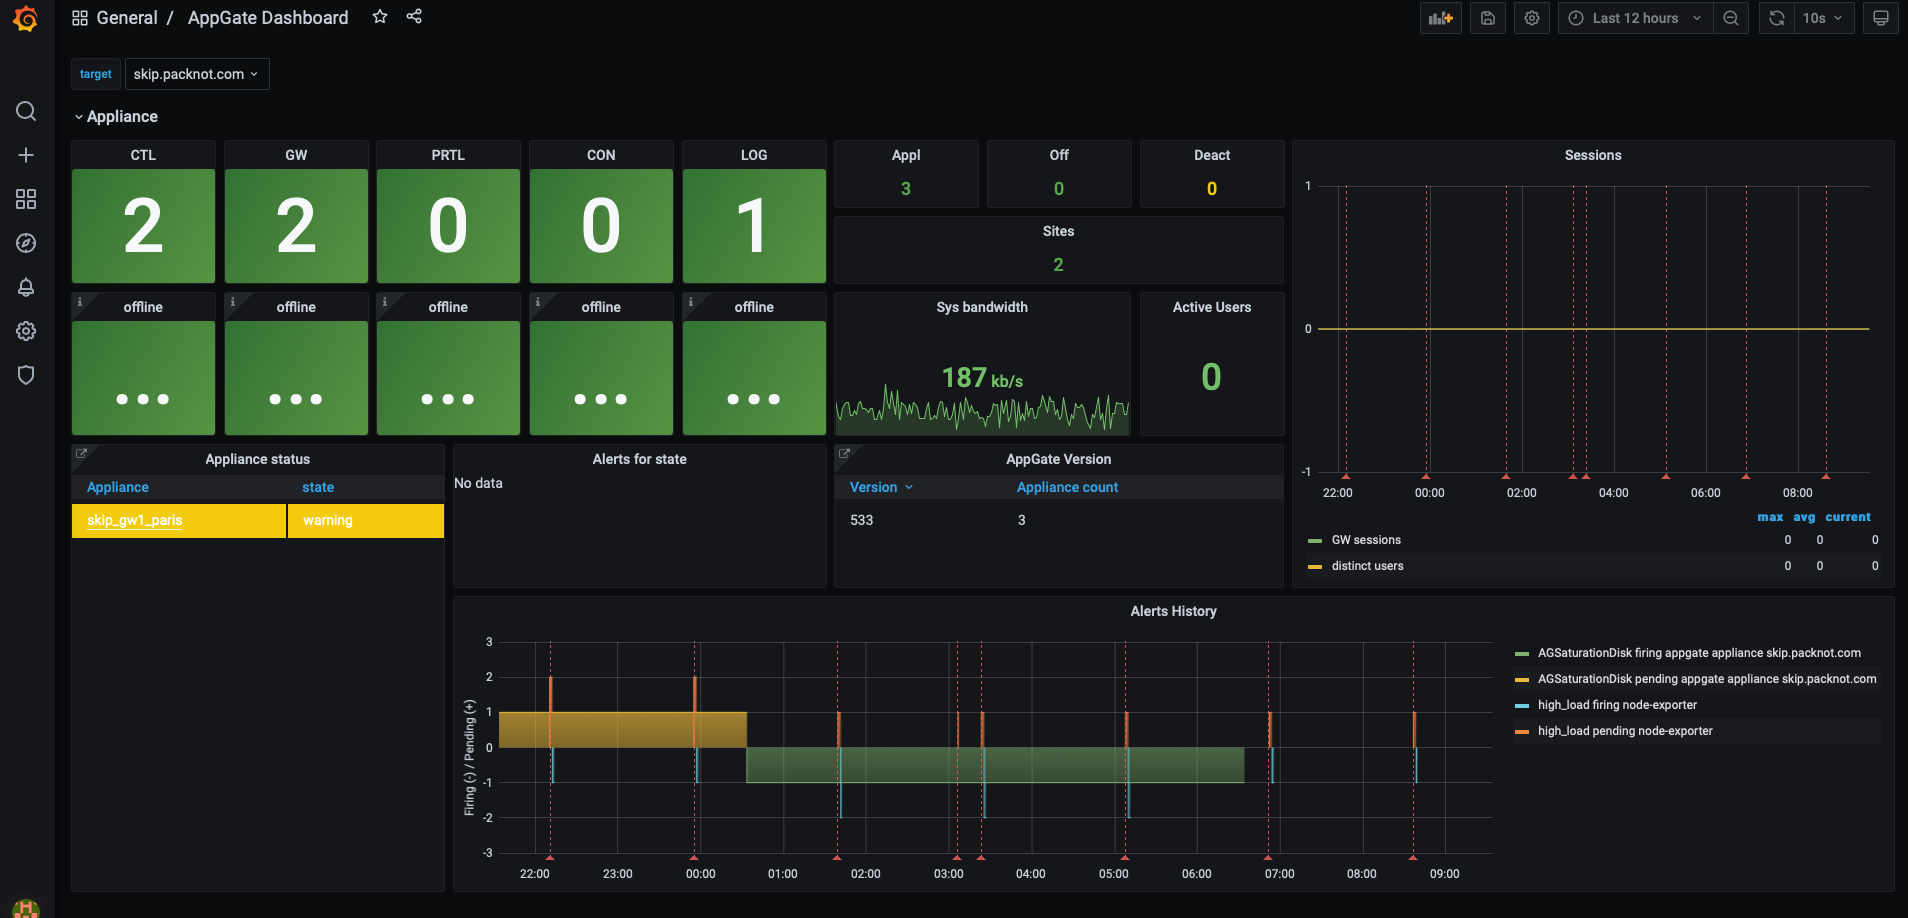
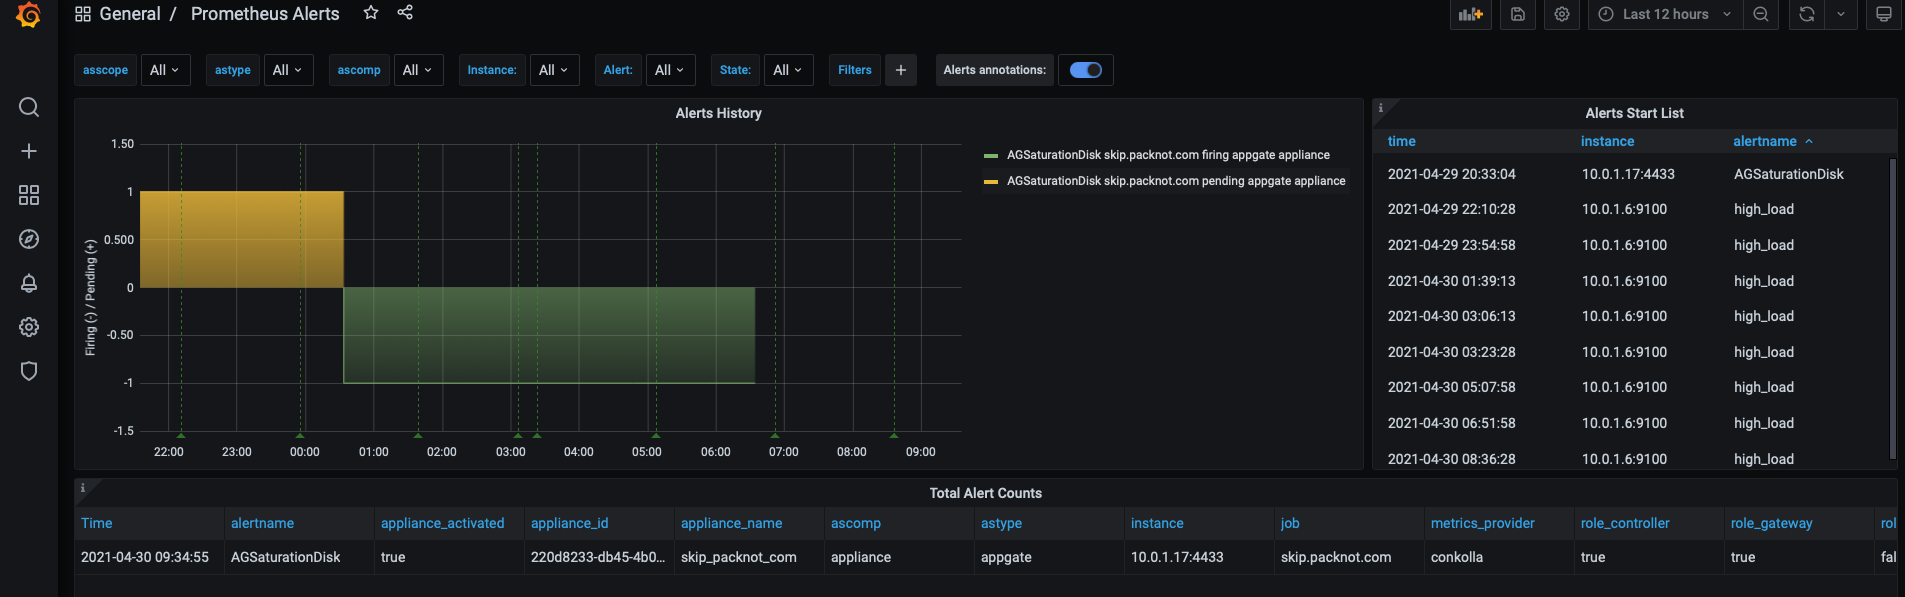
Alerts
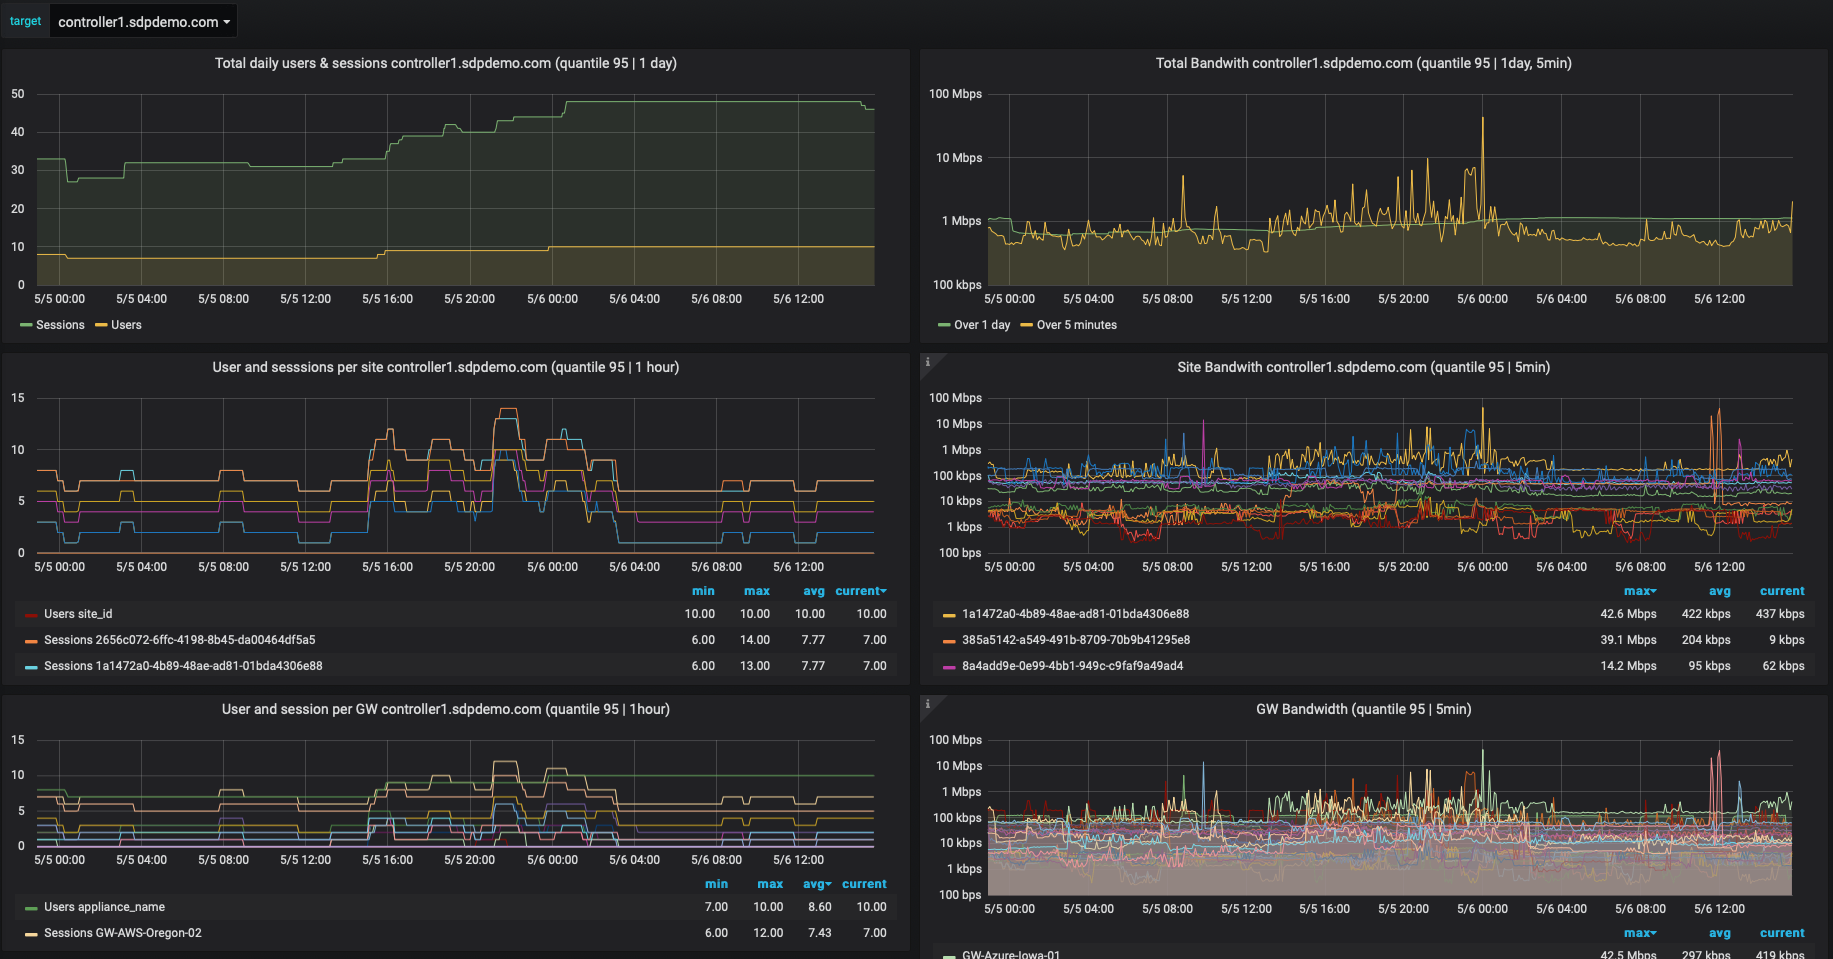
Bandwidth, current and historical data
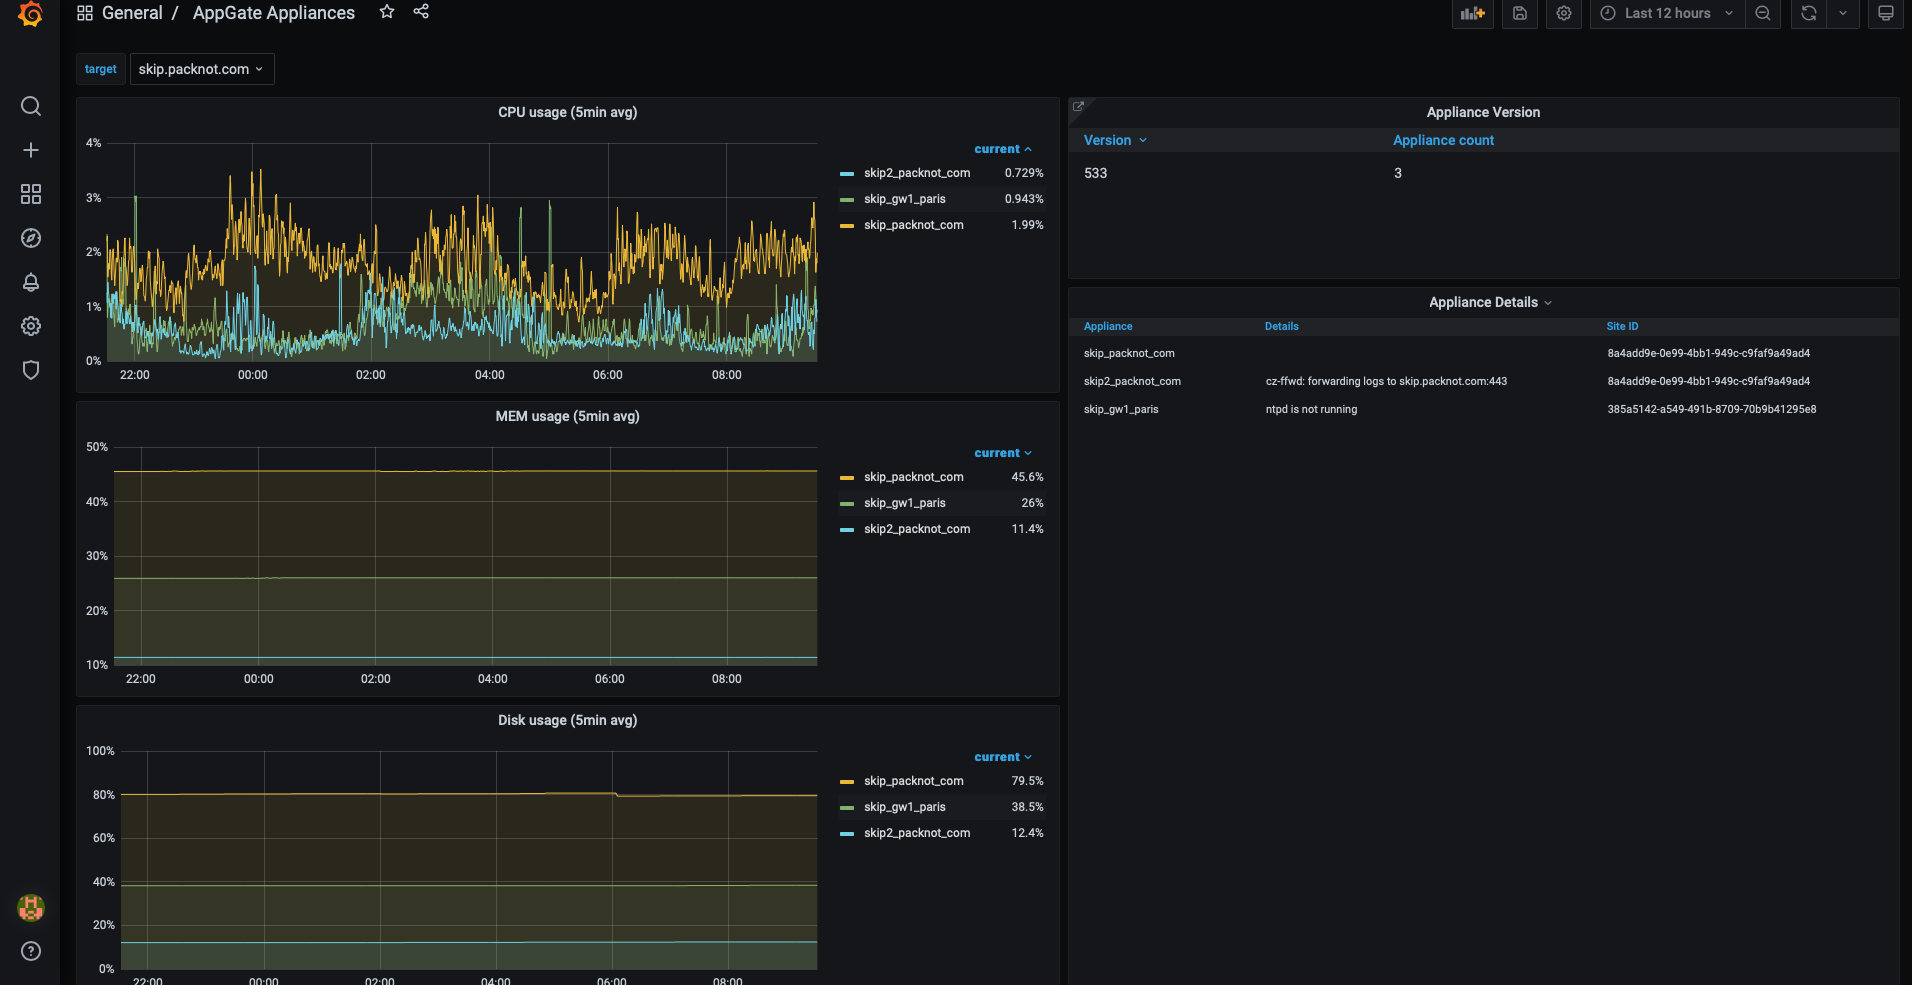
Appliances, resources and site degradation
Overview
Achitecture
Docker stack deployed on docker swarm
- Reverse proxy as entry point and certificate resolver
- Grafana with prometheus and alertmanager
- Appgate SDP remote prometheus exporter connecting to one or many Appgate SDP collectives
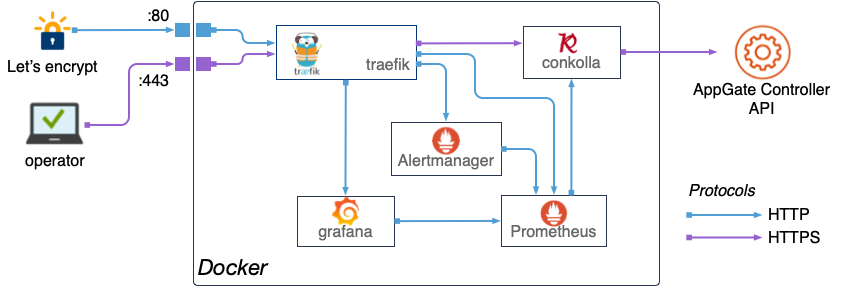
Technology used:
- treaefik, edge router (reverse proxy)
- conkolla, prometheus to appgate connector and prom exporter
- prometheus, scraper, database
- prometheus alertmanager alertmanager
- grafana, visualization and alerting front-end
Documents and structure
├── alertmanager
│   └── config.yml
├── _config.yml
├── conkolla
│   └── connections.yml
├── docker-appgate-monitor-stack.yml
├── grafana
│   ├── config.monitoring
│   └── provisioning
│       ├── dashboards
│       │   ├── Alerts.json
│       │   ├── AppGate\ Appliances.json
│       │   ├── AppGate\ Dashoard.json
│       │   ├── AppGate\ Details.json
│       │   ├── dashboard.yml
│       │   ├── Docker\ Conkolla\ Monitoring.json
│       │   └── Docker\ Prometheus\ Monitoring.json
│       └── datasources
│           └── datasource.yml
├── htapass
├── letsencrypt
├── prometheus
│   ├── alert.rules
│   ├── prometheus.yml
│   └── recording.rules
└── README.md
Preparations:
DNS
The subsystems will be accessible from the host’s IP address. Every subsystem is routed via a host name. They are defined in the docker stack file, and by default require the bellow host names. You will later match the DOMAIN name for the deployment with a environment variable. For now, you will need prepare on a domain owned by you the following records:
- Four A records (or alias) pointing to the host IP:
- agtraefik.
${DOMAIN} - agconkolla.
${DOMAIN} - agprometheus.
${DOMAIN} - agalertmanager.
${DOMAIN} - aggrafana.
{DOMAIN}
- agtraefik.
TLS certs
Traefik is taking care of the certificate resolving for the subsystems host certs. You will need simply provide an email address which will be used by traefik for let’s encrypt account. No email conversations will be required. The email will be set, as described below, before deployment in a environment variable.
Network requirements
Incoming traffic needs to reach to the host on:
80/TCPfor let’s encrypt (from any)443/TCPfor entry-point for traefik (from any/restricted)
Host
You can deploy the stack to an existing swarm. In this guide we setup a dedicated host and docker swarm. The host specs are as the following, assuming collective(s) with up to 60 appliances and using 90days retention of the time series (tsdb). The heavier queries prometheus/grafana will perform, the more memory and CPU you will require. For now, the following specs are proven to work fine:
- AWS: t3.standard, EC2 Amazon Linux Type 2
- Azure: Centos 7
- Disk, SSD: 40GB
Prepare EC2 Amazon linux Type 2
sudo amazon-linux-extras install -y docker
sudo systemctl enable docker
sudo systemctl start docker
sudo docker swarm init
Usermod
sudo usermod -a -G docker ec2-user #sudo gpasswd -a ec2-user docker
sudo setfacl -m user:ec2-user:rw /var/run/docker.sock
Git
sudo yum -y install git
htpasswd
sudo yum -y install httpd-tools
Prepare CentOS7 (Azure)
Installing docker community engine. Boils down to:
sudo yum remove docker \
		docker-client \
                docker-client-latest \
                docker-common \
                docker-latest \
                docker-latest-logrotate \
                docker-logrotate \
                docker-engine

sudo yum install -y yum-utils \
		device-mapper-persistent-data \
		lvm2

sudo yum-config-manager \
		--add-repo \
		https://download.docker.com/linux/centos/docker-ce.repo

sudo yum install -y docker-ce docker-ce-cli containerd.io
sudo systemctl start docker
sudo systemctl enable docker

sudo docker swarm init
User mod
export USER=<user as docker operator>
sudo usermod -a -G docker ${USER}
sudo setfacl -m user:${USER}:rw /var/run/docker.sock
Git
sudo yum -y install git
Htpasswd
yum -y install httpd-tools
SELinux changes:
sudo semanage port -a -t http_port_t  -p tcp 443 # websecure traefik entrypoint
sudo semanage port -a -t http_port_t  -p tcp 80  # lets encrypt traefik cert resolver
sudo setsebool httpd_can_network_connect 1 -P # allow conns (outgoing docker), add permanently
Configure
git clone https://github.com/appgate/appgate-prom-monitoring.git
Grafana
Adjust any settings if required in grafana/config.monitoring:
- The initial password can be replaced for user
admin, but must match same one inhtapass/grafana_users. You can later change and add users through the grafana UI, and you always need to add them in thegrafana_usersas well. - Set the host name for grafana:
GF_SERVER_ROOT_URL=https://grafana.${DOMAIN}
Note: you can also use docker secrets or any other secret/vault handler and use a volume to mount password and other flags, see here for more information.
Dashboards
We provision a set of dashboards during deployment from the directory: grafana/provisioning/dashboards:
- Appgate Dashboard
- Appgate Appliances info
- Appgate Details on users, sessions, bandwidth etc
- Conkolla monitoring
- Docker resource monitoring
The provisioning configuration is defined in the dashboard.json file, defaults are:
apiVersion: 1
providers:
- name: 'Prometheus'
  orgId: 1
  folder: ''
  type: file
  disableDeletion: false
  editable: true
  allowUiUpdates: true
  options:
    path: /etc/grafana/provisioning/dashboards
Read grafana documentation regarding use of provisioned dashboard
Conkolla setup
The conkolla can either connect automatically via:
- Connection definition from file
- Manually through the UI on
agconkolla.${DOMAIN} - By an API call/operator process
Conkolla support AWS KMS and can be given a base64 encoded AWS KMS blob with the additional parameters to decrytp/encrypt. You must use auto token renewel such conkolla always can fetch the data from the controller. Please read in the conkolla doc how to setup a conkolla user on the Appgate controller.
In this example we are using a connections.yml file with a plain text password for simplicity. An example will follow on a separate page to set up with an EC2 instance, IAM role and KMS. Now, the configuration file conkolla/connections.yml can have an example setup:
version: 1
connections:
- controllerURL: skip.packnot.com
  username: monitorUser
  password: plaintext
  skipVerifySSL: true
  autoTokenRenewal: true
  promCollector: true # enable prometheus collectors
  promTargetName: skip.packnot.com # the name under which this collective can be scraped
Prometheus
In prometheus/prometheus.yml, define job(s) according to the conkolla setup. Define one job as below for every target to be scraped from conkolla. The Configuration needs only 2 changes as indicated. The other settings must be kept as specified.
- job_name: '<job name>' # example skip.packnot.com
     dns_sd_configs:
     - names:
       - 'tasks.conkolla'
       type: 'A'
       port: 4433

     honor_timestamps: true
     honor_labels: true
     metrics_path: /metrics
     scheme: http
     params:
       target: [<target name>] # example skip.packnot.com
     relabel_configs:
       - source_labels: [__param_target]
         target_label: target
Alert rules and alert manager
There are just a few alerts defined in prometheus/alert.rules. The alerts are to notify about the system/instances/nodes and are not related to Appgate. Alerts are shown in a dedicated dashboard in grafana, deployed when provisioned.
You can add more alerts, and in the alertmanager/config.yml you can specify external receivers for alerts, example using slack:
route:
receiver: 'slack':
receivers:
  - name: 'slack'
    slack_configs:
      - send_resolved: true
        username: '<username>'
        channel: '#<channel-name>'
        api_url: '<incomming-webhook-url>'%
Passwords for basic authentication
If you want to use a single htpasswd file, then create symlinks to it with the same name as the expected file name depicted in the list below.
- create htpasswd users:
htpasswd -c htapass/grafana_users adminhtpasswd -c htapass/prometheus_users adminhtpasswd -c htapass/alertmanager_users adminhtpasswd -c htapass/conkolla_users adminhtpasswd -c htapass/traefik_users admin
Deploy
There are a few variables which are expected. You can either replace them directly in the docker compose file or use the method as described below by setting environment variables: Set the env variables (or set them in the docker compose file by hand)
export DOMAIN=<domain>
export LE_EMAILADDRESS=<emaoiladdress>
Run the deployment from the directory of the yml file. This is due to how the docker configuration currently defines paths to mount.
HOSTNAME=$(hostname) docker stack deploy -c docker-appgate-monitor-stack.yml agmon
After the deployment has successfully finished you might give it a minute so traefik can generate the TLS certificates. Then verify you can get to the endpoints the endpoints:
- https://agtraefik.
${DOMAIN}/dashboard/ - https://agconkolla.
{DOMAIN} - https://agprometheus.
${DOMAIN} - https://agalertmanager.
${DOMAIN} - https://aggrafana.
{DOMAIN}
Maintain, update, trouble shoot
Check the services:
docker service ls
Access logfiles:
docker service logs [-f] <service_name>
Update an image for a service (see the compose file for image details):
docker pull grafana/grafana
docker service update --image grafana/grafana <service_name>
Update a service after the service’s config file changed:
docker service update --force <service_name>
Update the deployment when the compose file changed:
- same as
run the deployment. - Make sure environment variables are set (or set in the compose file).
List the volumes
docker volume ls
Inspect volumes of grafana/prometheus stored data:
docker volume inspect <volume_name>